Goals of the testing phase. The primary goal of the testing phase is to verify the antenna design’s compliance with per- formance requirements by evaluating key performance metrics.
This includes ensuring that the resonant frequency falls within the target range of 423–432 MHz and achieving higher isola- tion (SI reduction) with the EBG structure. Additionally,
the testing aims to verify the return loss and bandwidth for values of -10 dB or lower to ensure proper impedance matching, validate the radiation patterns for both Tx and Rx elements,
and measure the antenna gain to confirm alignment with design expectations. The stability of the antenna’s performance will also be assessed in various environments, including an
indoor environment with multipath and a controlled anechoic chamber environment.
Description of test environments: The evaluation was conducted in two distinct environments
(1) Indoor Testing: The initial objective was to measure the S-parameters of the unit antenna in an indoor environment, composed of a large lab area. The Vector Network Analyzer (VNA) was
calibrated for a frequency range of 360 MHz to 460 MHz. The LiteVNA, a portable vector network analyzer operating from 50 kHz to 6.3 GHz, was used to measure S11 and S21. Its design,
based on the NanoVNA and SAA2, provides a compact solution for measuring reflection and transmission coefficients without requiring a bulky analyzer. The LiteVNA employs a single mixer,
enabling S11 and S21 measurements via RF switching, as well as TDR/DTF measurements through IFFT calculations.
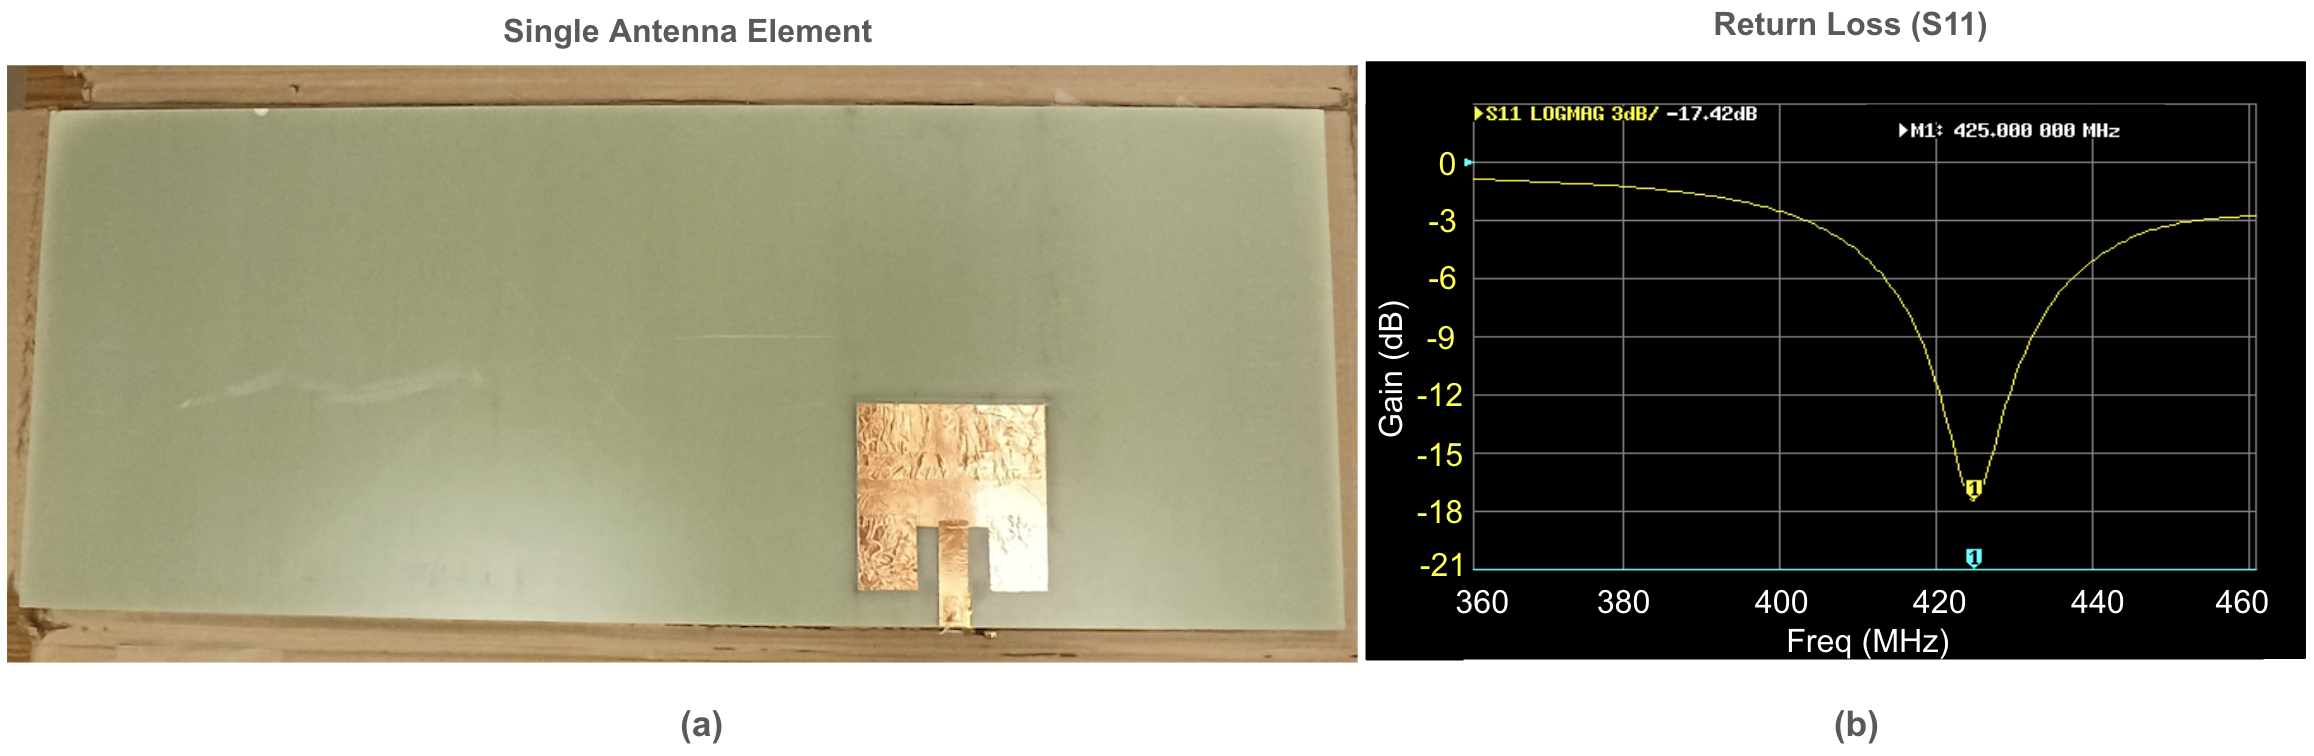
Left figure below (a) shows the single Tx (Rx) antenna taped out on FR4 material using copper tape, while right figure (b) presents the measured return loss for the single antenna element. The x-axis of
the VNA plot spans 100 MHz, starting from 360 MHz, with subdivisions of 20 MHz. The y-axis (yellow numbers) is logarithmically scaled at 3 dB per division. At the resonance frequency
of 425 MHz, the measured S11 is -17.42 dB, and the bandwidth at -10 dB return loss is approximately 15 MHz.
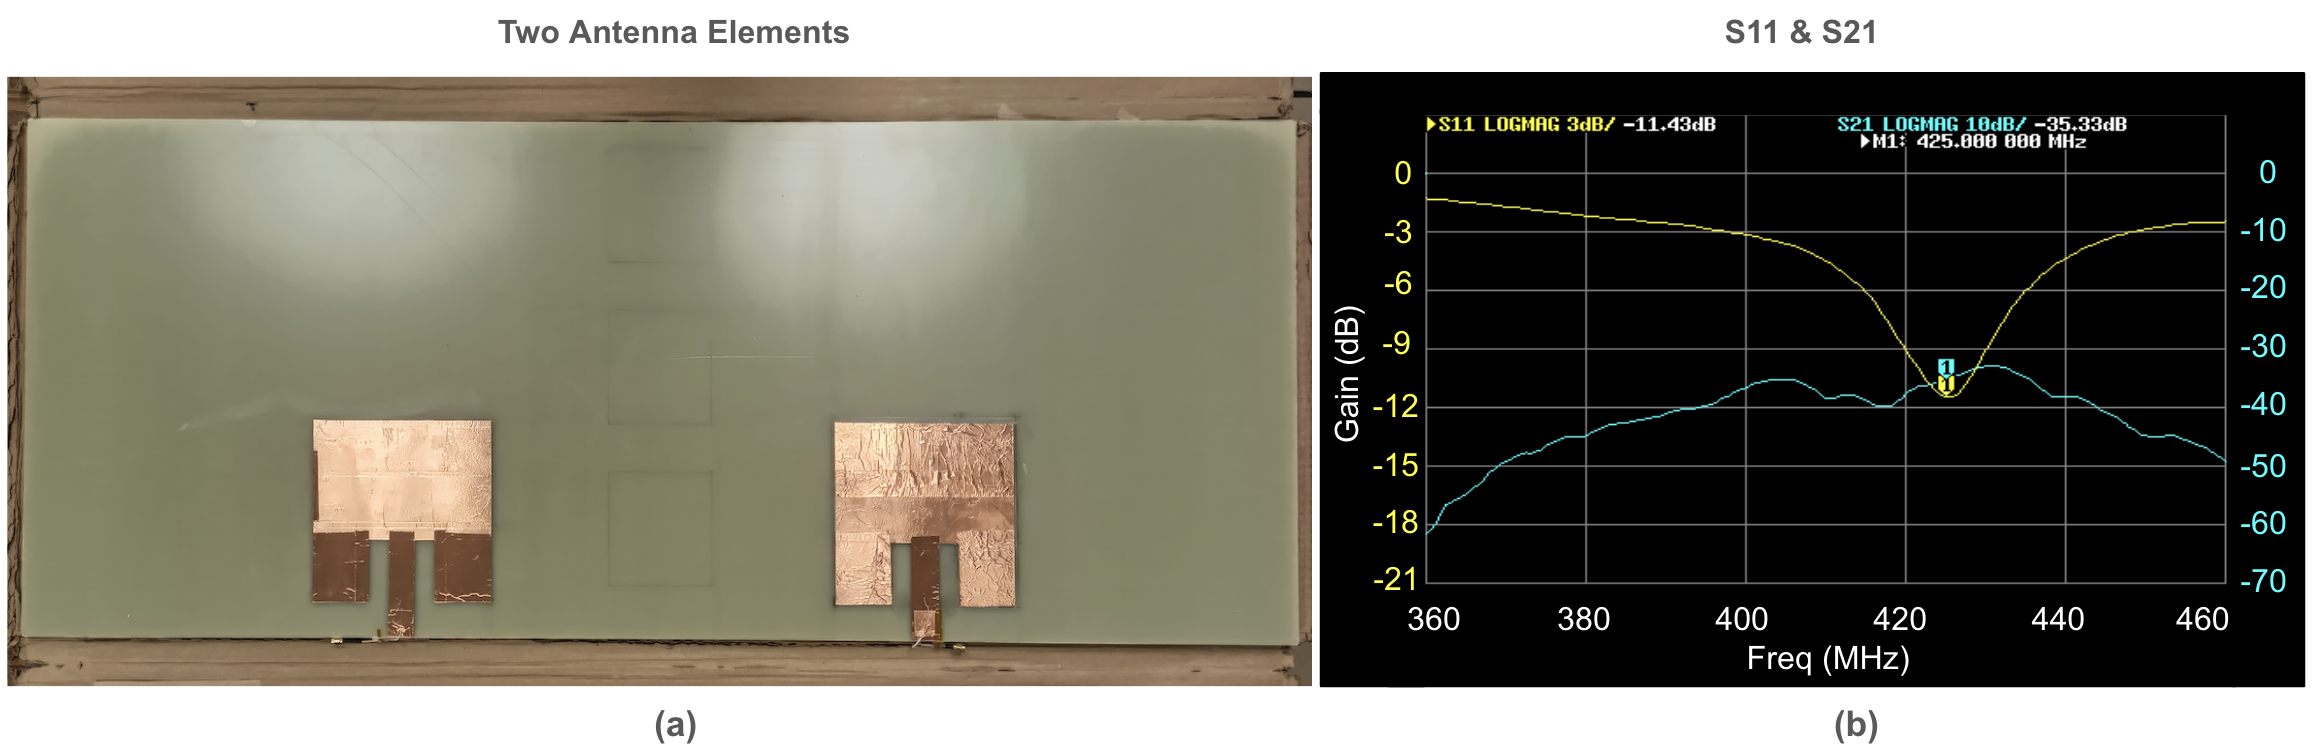
Left figure below (a) illustrates two antenna elements taped out on FR4 material using copper tape. Right figure (b) shows the measured S11 for a single antenna after adding the second antenna element, along with the measured S21 between the two antenna elements in free space. The y-axis on the left (yellow numbers), scaled at 3 dB per division, represents the S11 gain, while the y-axis on the right (cyan numbers), scaled at 10 dB per division, represents the S21 gain. After adding the second antenna, at the resonance frequency of 425 MHz, the measured S11 is -11.43 dB, with a bandwidth of approximately 9 MHz at -10 dB return loss. The S21 value at the target frequency is -35.33 dB.
Multiple configurations of the EBG structure were tested next and placed between the Tx and Rx antenna elements. Isolation and return loss were measured for various configurations of the EBGs.
In partciular, after taping out EBGs we created different configurations through small (e.g., 1 mm) increase or decrease in EBG dimensions to find the configuration with the best performance.
Measurements were then taken after applying the EBG structure, with each configuration compared for S11 and S21 parameters.
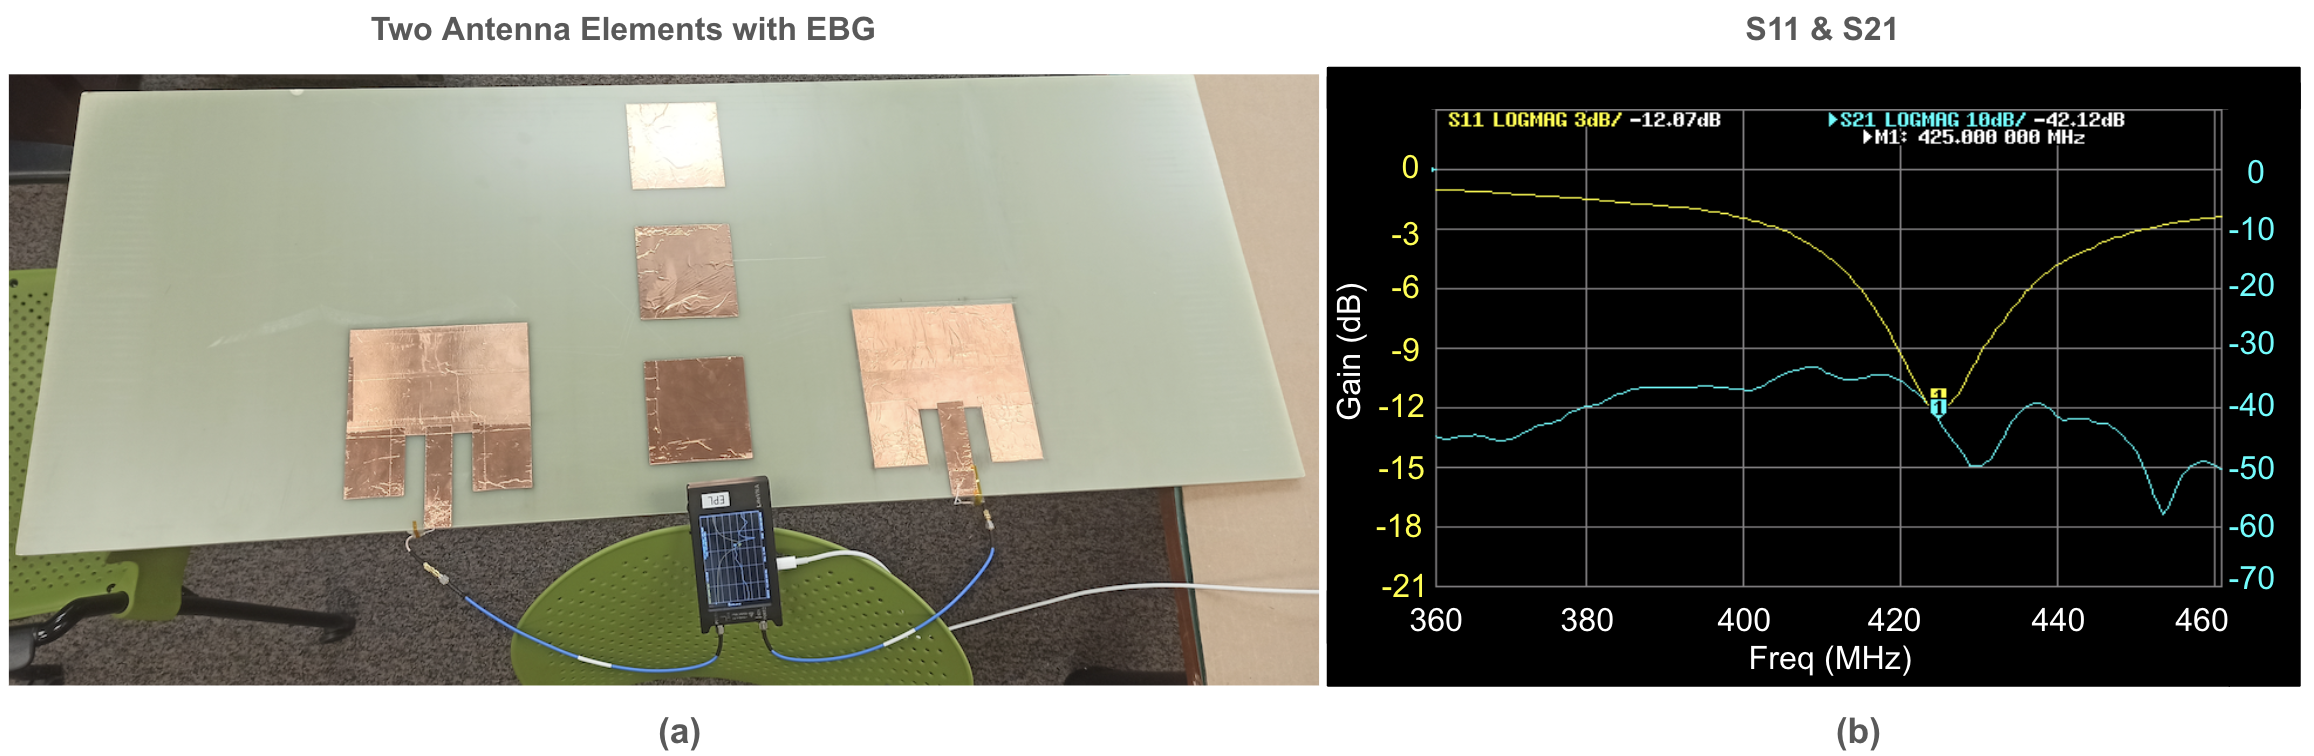
Left figure below (a) presents the FD antenna system after placing the best EBG structure between the two antenna elements using copper tape. Right figure (b) shows the measured return loss of a single antenna
and the isolation between the two antenna elements indoor after incorporating the EBGs. After applying the EBGs, at the resonance frequency of 425 MHz, the measured S11 is -12.87 dB, with a bandwidth
of approximately 10 MHz at -10 dB return loss. The S21 value at the target frequency is -42.12 dB, indicating that applying EBGs results in an improvement of about 7 dB in the indoor environment.
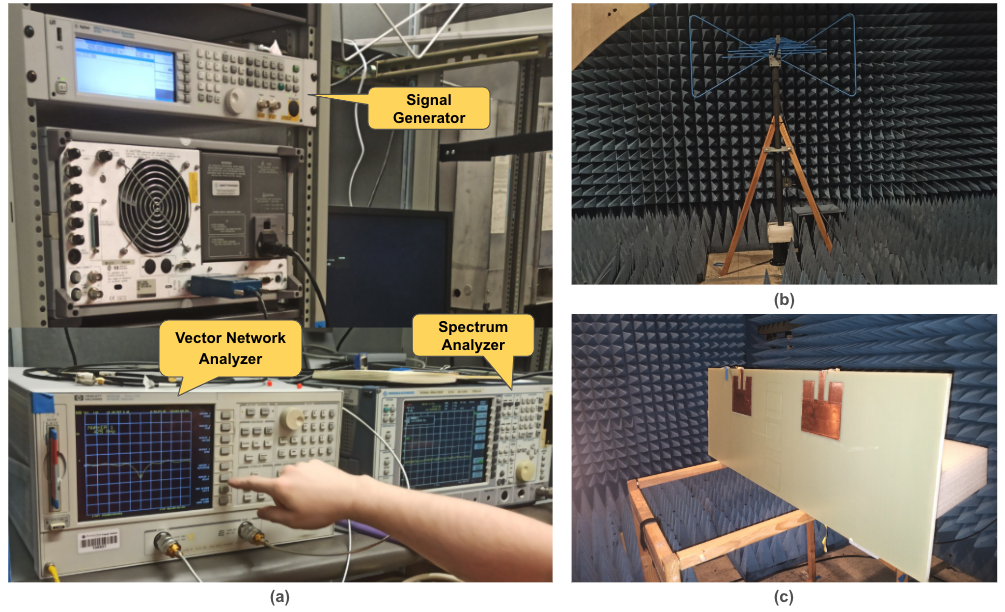
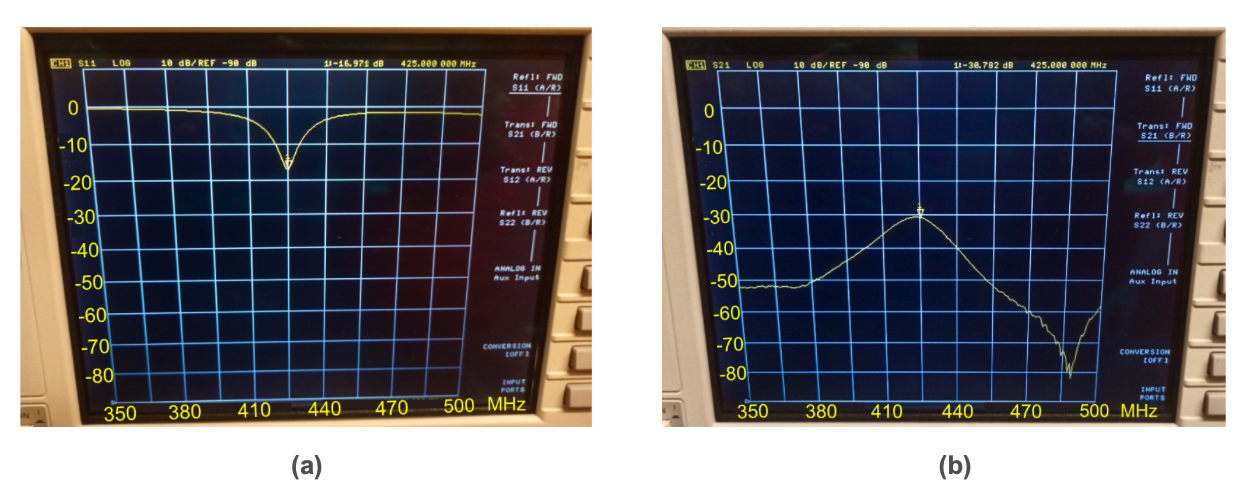
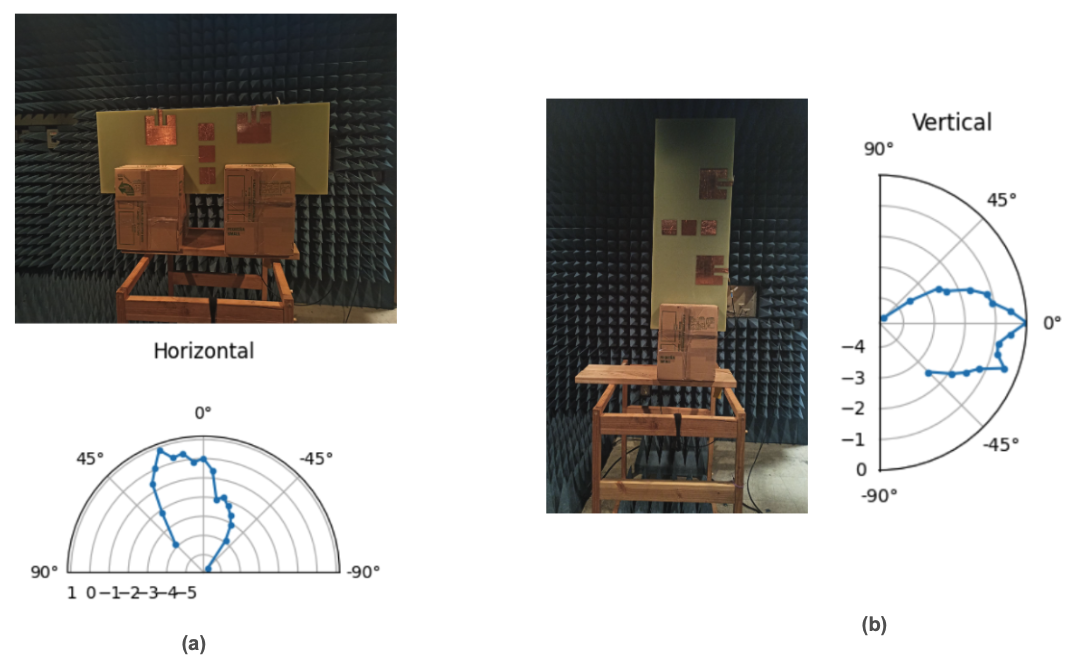
(2) Anechoic Chamber Testing: The left figure below (a) shows the equipment and measurement setup used in the anechoic chamber. A Hewlett Packard (8753E) vector network analyzer was employed to measure return loss and isolation in a controlled environment. Top right figure (b) shows the position of the log-periodic antenna used as the RA. The FD patch antenna was placed in the chamber using a wooden structure, as depicted in figure (c), which held the antenna under test (AUT).
Left figure below (a) presents the measured return loss for the unit antenna in the anechoic chamber. At the resonance frequency of 425 MHz, the measured S11 is -16.97 dB, with a bandwidth of approximately 10 MHz at -10 dB return loss. The measured S21 value at the target frequency, without EBG incorporation, is -30.78 dB, as shown in right figure (b). These measurements validate the return loss and isolation values obtained in both the simulation environment and free space.
Radiation patterns were subsequently measured at the target frequency of 425 MHz. For the far-field measurement setup, a signal generator as shown above was used to generate a continuous waveform at 425 MHz with 0 dBm power, which was fed into the reference antenna (RA). Antenna gain was evaluated using an RA with a gain of +6 dBm, positioned 350 cm away. The free space path loss at 425 MHz was calculated as 35.98 dB, with cable losses measured at 3.14 dB. The received gain at the AUT was then measured by the spectrum analyzer at the target frequency of 425 MHz. The position of the log-periodic antenna used as the RA was shown above. Radiation patterns were evaluated horizontally, covering angles from −45° to +45° by rotating the wooden structure and cardboard boxes designed to hold the antenna in the correct position and angle. Left figure below (a) illustrates the setup used for rotating the antenna, along with the radiation pattern of the AUT in the azimuth plane (horizontal plane) when the patch antenna is positioned upside down. Right figure (b) shows the radiation pattern of the AUT in the azimuth plane when the patch antenna is positioned from right to left.
Measured vs. simulated results:
Return Loss : S11 for the first antenna before applying the second antenna showed good matching within the design specifications. After integrating the second antenna, minor shifts were observed, which were mitigated by fine-tuning
the patch antenna dimensions.
Isolation : Without the EBG structure, isolation values were between -30 dB (in anechoic chamber) and -35 dB (indoors). Adding the EBG improved isolation by about 7 dB (-42 dB indoor). This is, however, lower than more than 60 dB of
isolation that we could optimize through HFSS simulations.
Radiation Patterns: Anechoic chamber tests confirmed sym- metrical and consistent radiation patterns for both Tx and Rx elements across the measured angles.
Gain and Bandwidth: The antenna system demonstrated a bandwidth efficiency of 9.63 MHz, with gain measurements aligning closely with simulated results.